We often hear it said that breakfast is the most important meal of the day and trying to put a healthy cereal in front of our children is something we invest our time and energy into achieving.
But how easy is it to put a healthy (and appealing) breakfast in front of our children or even ourselves?
Breakfast cereal manufacturers were called to action after a survey by Which! in 2009, that found there were excessive levels of sugar in the cereals marketed specifically towards children.
Fast forward a decade and we find ourselves still having to decipher what is in our attractively packaged breakfast cereal boxes. We now readily resort to using the ‘traffic light’ system, introduced by the government in 2013, and used on the packaging of pre-packaged foods and drinks, which help us make healthy choices. The GREEN light for sugar relates to items that contain no more than 5g of sugar per 100g according to the traffic light guidelines. Products that contain more than 22.5g per 100g of sugar are classed as ‘high’ and are coded RED.
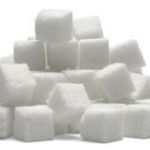
In the UK, the average intake of sugar by an adult, should not exceed 30g per day (7 cubes). For children aged 7 – 10 years, this is 24g (6 cubes) and 4 – 6-year olds 19g (5 cubes).
That sounds perfectly achievable doesn’t it? Afterall, who in their right mind would put 7 sugar cubes in their breakfast? The truth is though, you could blow your entire daily allowance quite easily before breakfast is even finished if you don’t pay attention to what you are eating?
*Too much added sugar increases heart disease risk factors such as obesity, high blood pressure and inflammation. High-sugar diets have been linked to an increased risk of dying from heart disease.
We have listed some of our most popular breakfast choices and their sugar content. It is worth noting that the average breakfast portion ‘should’ be 30g for an adult, however, unless you are weighing your cereal, you are likely to be having far more than 30g as a portion. There is a useful photographic representation of bowls of cereal and their weight here.
|
Ref: British Heart Foundation*** |
Cereal |
Sugar Content |
Average Sugar Content Per serving |
|
100g |
Granola with Chocolate |
48g |
14.4g |
|
100g |
Sugar Puffs |
35g |
10.5g |
|
100g |
Frosties |
35g |
10.5g |
|
100g |
Cheerios |
34g |
10.2g |
|
100g |
Muesli |
21g |
6.3g |
|
100g |
Granola with Fruit |
18g |
5.4g |
|
100g |
Muesli |
15g |
4.5g |
|
100g |
Muesli Sugar Free |
13g |
4g |
|
100g |
Weetabix |
12.5g |
3.75g |
|
100g |
Special K |
12g |
3.6g |
|
100g |
Cornflakes |
10g |
3g |
|
100g |
Shredded Whole wheat |
0.7g |
0.2g |
|
100g |
Porridge |
0g |
0g |
In order to avoid the obvious pitfalls of selecting the most attractive packaging and paying the cost for it in sugar intake, look for a few clues that the manufacture has reduced the sugar levels during the manufacturing process. They are normally boldly emblazoned ‘LOW SUGAR’ on the front of boxes and packets.
Also, it is worth noting that the sugar in the milk or yogurt you add to your cereal, will need to be calculated into the ‘breakfast’ sugar intake for a true value of ‘breakfast sugar’. Dairy milk contains sugar in the form of lactose which different to refined sugar which contains sucrose. There is a useful article here which discusses natural versus refined sugars. If you prefer non-dairy milks and yoghurts (for example oat or one of the nut options) then please be aware that many of these are quite highly sweetened!
* Written by Jillian Kubala, MS, RD on June 3, 2018
**Although porridge is an excellent breakfast choice in terms of sugar content, diabetics need to be aware that the high content of carbohydrates directly affect blood sugar levels (not all porridges are made from oats). Try getting yours from a health food shop and choosing jumbo unrolled oats. Oatmeal has a low glycaemic index; it can help maintain glucose levels. This can be beneficial for people with diabetes, who especially need to manage their blood sugar levels. – ref: www.healthline.com

